Autumn of Observability
About the event
Fall into Observability: Grafana, SLOs & Kubernetes
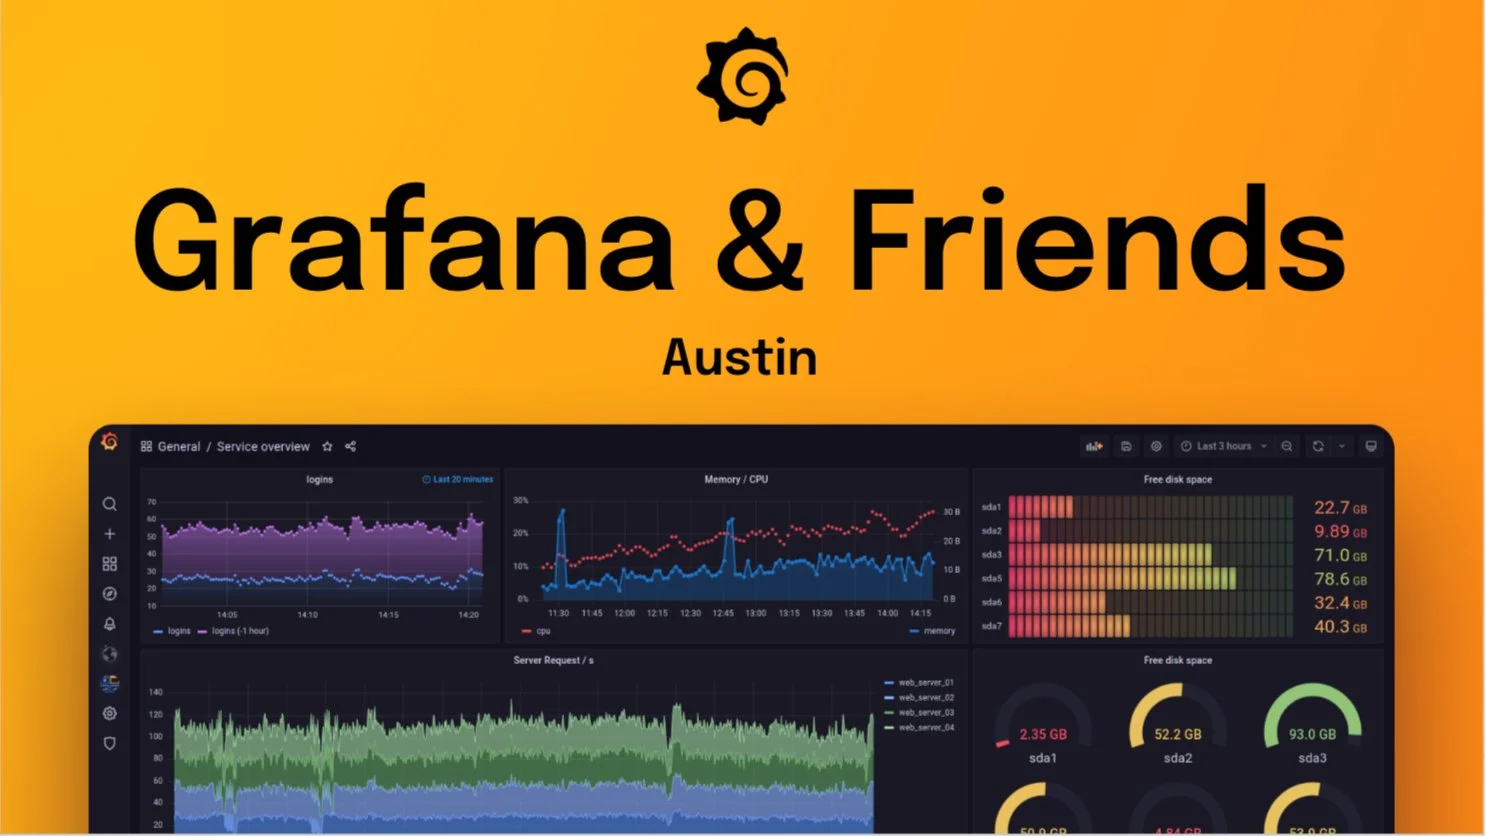
Join us for an evening of practical talks about Grafana, Kubernetes, SLOs, and platform observability.
Building Workload-Aware SLO Dashboards for Mixed Kubernetes Workloads
Modern Kubernetes platforms often support very different kinds of workloads, including interactive APIs, long-running reasoning requests, asynchronous processing, and batch jobs. Yet teams frequently monitor them through the same dashboards and reliability thresholds. In this talk, I’ll show how to build workload-aware SLO dashboards in Grafana by separating latency by workload class, defining workload-specific good and bad events, calculating error-budget burn rates, using multi-window alerting, and correlating reliability degradation with deployments. I’ll also compare a manual PromQL-based approach with Grafana Cloud SLOs using a Synthetic Monitoring example.
Grafana for Platform Teams: Every Kubernetes Cluster, Every Region, One Dashboard
Internal developer platforms (IDPs) do not just run workloads. They provision and reconcile entire Kubernetes clusters for other teams across regions. When a platform control plane manages hundreds of those clusters, the SRE question tends to be: which cluster is stuck, at which step, and who owns it? This talk shows how we built a single Grafana dashboard that answers that question. We’ll cover which telemetry actually matters at fleet scale, including cluster health, ownership, region, version, and capacity, and, just as importantly, what we chose to leave out. Practical, demo-driven, and useful to anyone running Kubernetes-based platforms.
Live Demo: GCX and Agents
We’ll also include a live demo using GCX and Agents, bringing the ideas from both talks together with real Grafana workflows and examples.